Research Technologies for Teaching and Learning
As we begin a new semester, it’s a good time to remind you of the academic research technologies available to faculty, students, and staff in the Loyola community. The Learning Technologies and Innovation group supports a suite of applications to enhance teaching, learning, and research. These tools can be used for quantitative data analysis, qualitative data analysis (NVivo), and survey administration (Qualtrics). Our team is available for support, consultation, and limited training.
How can I schedule a consultation?
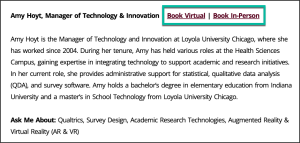
Schedule a virtual or in-person consultation from our LTI Directory page. On this page, you’ll find a list of all our team members, each with an ‘Ask Me About’ section. Use this section to determine who can best facilitate your request. Once you have identified an expert, use the Book Virtual or Book In-Person options to find a mutually convenient time to meet.
How can I request software installations on my personal device?
Many of our software packages can be installed on personal devices, including SPSS Statistics, NVivo, STATA, and SAS. To find more information about the request process for each application, view the corresponding page for the software on the Academic Research Technologies webpage. If the software is available for download, you can complete and submit a self-service request form to the LUC Service Desk. Once your request is received and processed, you will receive access to the necessary files to download the software.
How can I request help with a Qualtrics project?
Qualtrics at Loyola is a campus-wide, web-based survey platform that students, faculty, and staff can use to create, distribute, and analyze online surveys for university-related research, assessment, and academic projects.
As you work with Qualtrics, the LTI team can help with:
- Designing effective surveys that align with research goals.
- Setting up distribution methods and sampling strategies.
- Configuring logic, branching, and advanced question types.
- Managing data collection and export.
You can schedule a consultation to discuss any of the above areas, or, for more in-depth projects or if you would like our team to create your survey or set up the distribution, submit a Qualtrics Project Request form.